Learning to understand W-CDMA
Return to homepage
Here are a couple of plots of the experiment ( 67k ):
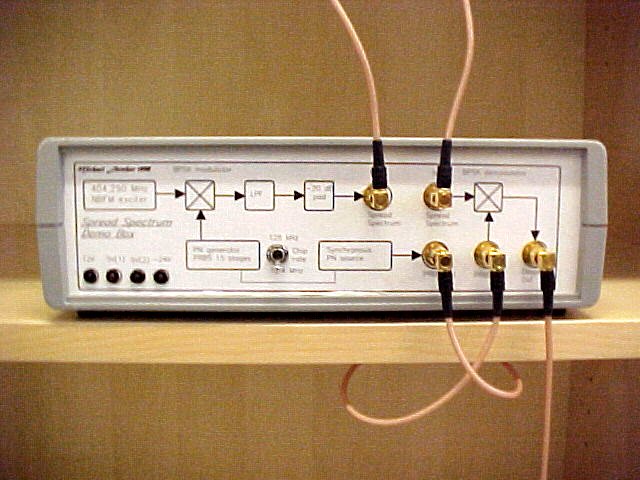
 The plot on the left shows what the spectrum looks like at RF on an Anritsu MS2661B
spectrum analyser. In this test the spreading code chip rate was 5.12 MHz. I have been
experimenting with chip rates from 128 kHz to 12.8 MHz. The spectrum is unfiltered.
Both baseband and RF filtering at IF can be used. This baseband filtering results in
characteristic roll-off features of the spectrum and raised cosine filtering is a common
type used. Filtering is also applied at the receiver end of the system.
The spreading codes I have been using are 2exp.7 and 2exp.15 length PRBS sequences. The
modulation is direct sequence BPSK to keep things simple.
On the right you can see the despread, recovered original carrier containing the modulation
information ( in this case a NBFM carrier modulated at 800 Hz with a 2.5 kHz pp deviation ).
The lower screen of the spectrum analyser shows the demodulated 800 Hz sinewave.
The plot on the left shows what the spectrum looks like at RF on an Anritsu MS2661B
spectrum analyser. In this test the spreading code chip rate was 5.12 MHz. I have been
experimenting with chip rates from 128 kHz to 12.8 MHz. The spectrum is unfiltered.
Both baseband and RF filtering at IF can be used. This baseband filtering results in
characteristic roll-off features of the spectrum and raised cosine filtering is a common
type used. Filtering is also applied at the receiver end of the system.
The spreading codes I have been using are 2exp.7 and 2exp.15 length PRBS sequences. The
modulation is direct sequence BPSK to keep things simple.
On the right you can see the despread, recovered original carrier containing the modulation
information ( in this case a NBFM carrier modulated at 800 Hz with a 2.5 kHz pp deviation ).
The lower screen of the spectrum analyser shows the demodulated 800 Hz sinewave.
Updated 01.04.1999