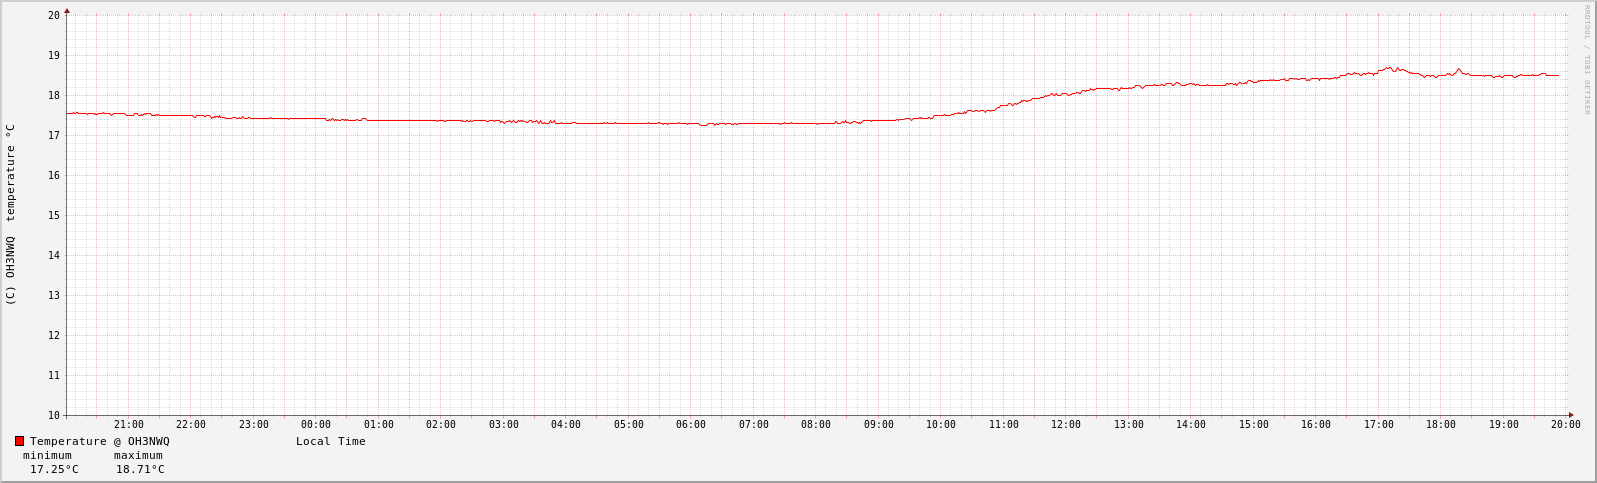
Graph is updated every two hours.
Link to outside temperature and radiation.
Time is now 23.02.2026 16:52:23z
or 23.02.2026 18:52:23 local time.
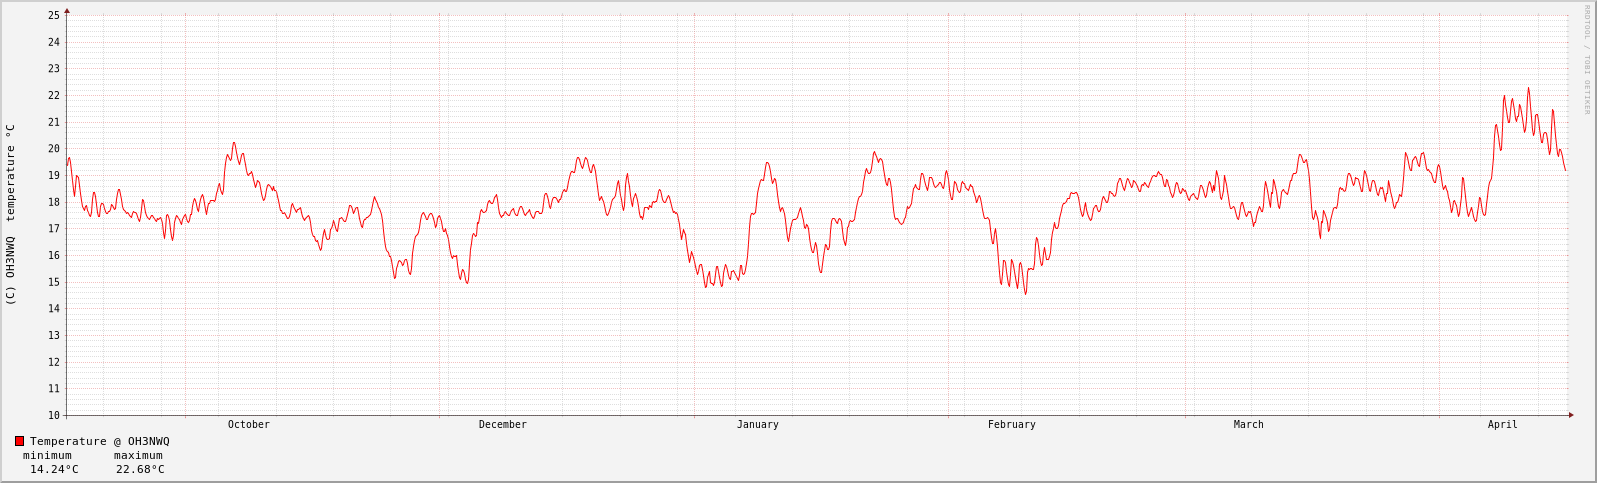
Measured with DS18S20,
- Version 1 (2005-2017) used DS1820 sensor and PIC16C84 running PicArbiter with modified controller code as a one-wire to RS232 converter, and a PC running logarbiter daemon
- Version 2 (2017 - ) uses DS18S20 connected directly to a GPIO pin of a Raspberry Pi 3B to read the sensor. Source code
KOPIOSTO:n asiakkaille: mikään KOPIOSTO:n myöntämä lupa ei kata tätä palvelua, joten KOPIOSTO ei voi myöntää minkäänlaisia lupia tai oikeuksia tämän sivun kuviin.
Koulut, jotka eivät maksa suojelurahaa KOPIOSTO:lle, saavat käyttää tämän sivun kuvia opetuksessa alla mainitun lisenssin mukaisesti.
© 2005-2025 OH3NWQ

Temperature Graphs by OH3NWQ is licensed under a Creative Commons Attribution-ShareAlike 3.0 Unported License.