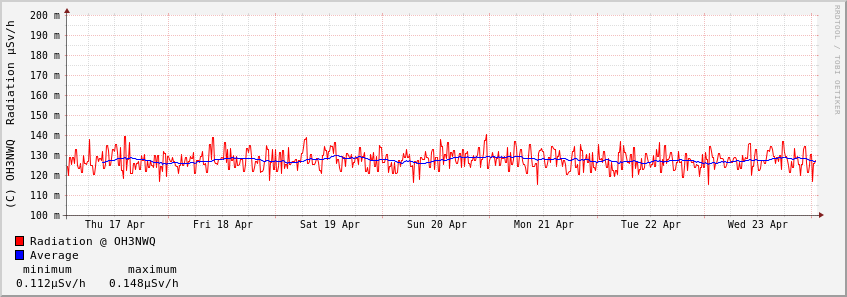
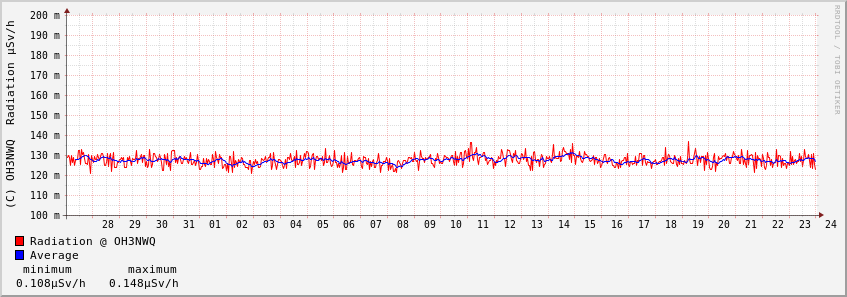
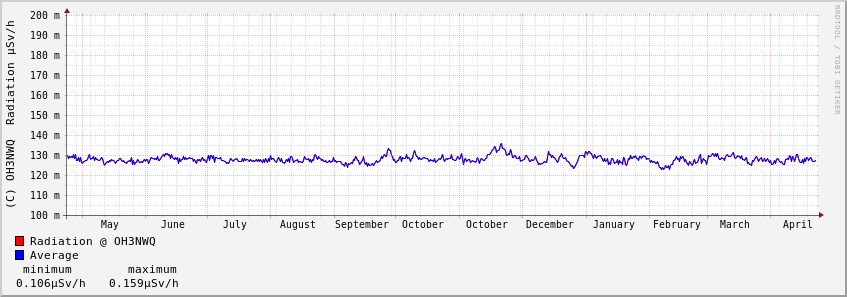
Severe electrical disturbances, such as thunder storms, and cosmic gamma ray bursts may show as spikes in the chart.
Link to outside and inside temperature measurements.
Time is now 26.03.2026 19:39:53z
or 26.03.2026 21:39:53 local time.
Lisätietoa säteilyannoksista Säteilyturvakeskuksen sivulta.
Measured with:
- GEO-210 pancake Geiger-Müller counter probe by K0FF.
- Modified Ludlum Model 177 alarm ratemeter for supplying 900 VDC and conditioning the pulses from the probe to TTL levels.
- Version 1 used a home made 24 bit counter using a 16F84 attached to the parallel printer port and program to read the counter through the parallel port and to feed the rrd database.
- Version 2 uses a GPIO pin of a Raspberry Pi 3B to count the pulses. The RRD database is run within the Raspberry Pi. Source code
KOPIOSTO:n asiakkaille: mikään KOPIOSTO:n myöntämä lupa ei kata tätä palvelua, joten KOPIOSTO ei voi myöntää minkäänlaisia lupia tai oikeuksia tämän sivun kuviin.
Koulut, jotka eivät maksa suojelurahaa KOPIOSTO:lle, saavat käyttää tämän sivun sisältöä opetuksessa alla mainitun lisenssin mukaisesti.
© 2007-2025 OH3NWQ

Radiation Graphs by OH3NWQ
is licensed under a Creative Commons
Attribution-ShareAlike 3.0 Unported License.